RiskPe Sales Dashboard: Building BI from Scratch
Develop MVP predictive models for sustainability startups.
💡
I am working on anonymizing the data with the consent of the company to present the complete project on github. Stay tuned!
RiskPe Sales Dashboard
Internal Analytics Tool | Python, Plotly | Insurance Business Intelligence
As part of my work at RiskPe, an early-stage insurance startup, I am developing a sales dashboard to provide the founding team and key stakeholders with real-time visibility into business performance. The goal was to move beyond ad-hoc spreadsheets and create a centralized, visually clear analytics layer to inform strategy and operations.
Business Objective
In a fast-moving startup environment, decisions need to be data-backed but fast. This dashboard helps RiskPe:
- Track month-over-month and year-over-year sales performance
- Spot emerging trends and seasonal shifts
- Identify the most successful insurance products and potential areas for optimization
Key Features
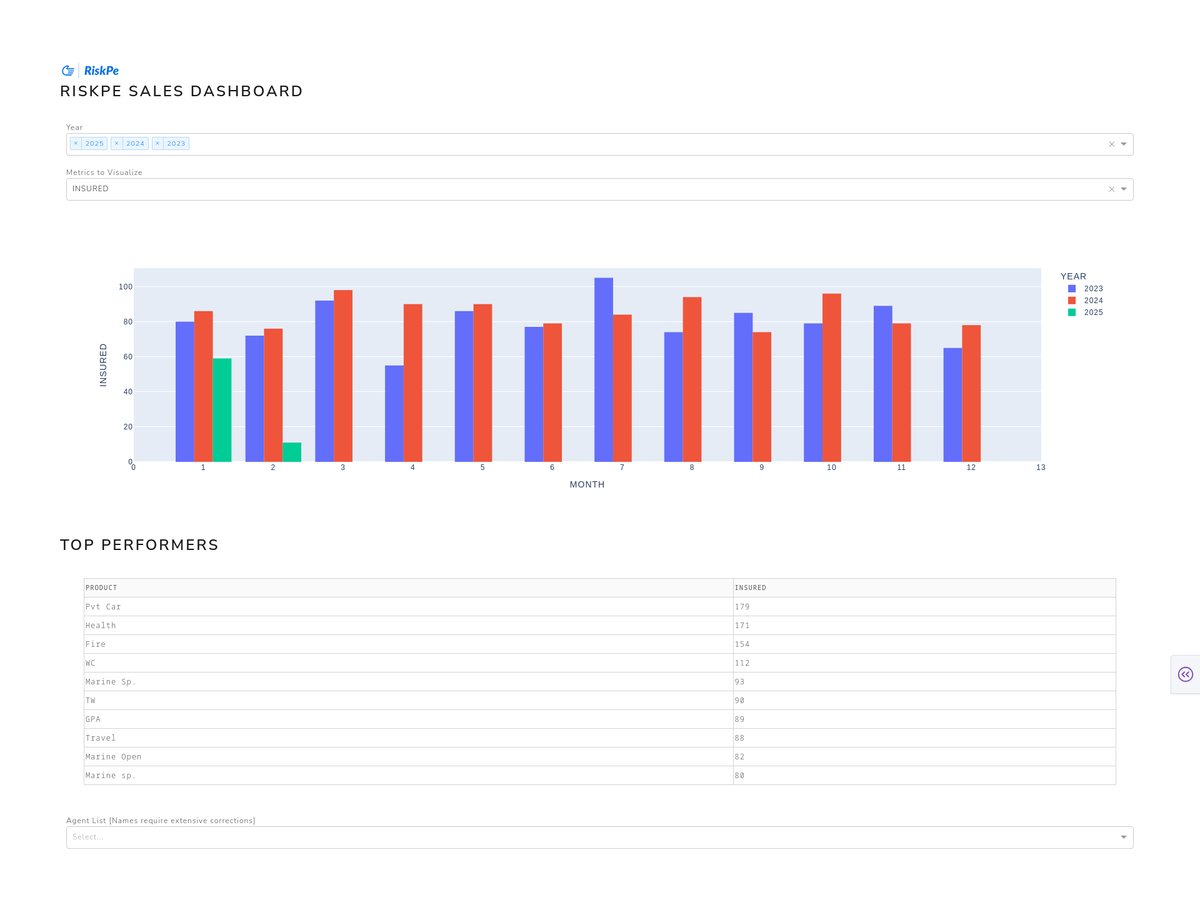
- Multi-Year Sales Comparison
Bar charts show insured counts across 2023–2025, helping identify trends and performance spikes. - Top-Performing Products Table
Clearly surfaces the highest-selling insurance products, such as Pvt Car, Health, and Fire. - Metric Flexibility (Planned)
Users will be able to toggle between different KPIs like revenue, claims, and growth rate. - Executive Summary Generator (In Progress)
This tool will generate automatic, natural-language summaries of key insights to make the dashboard more accessible for non-technical decision-makers. - Data Quality Notes
Agent names are flagged for correction—reflecting the team’s iterative approach to improving data hygiene while maintaining agility.
Technical Highlights
- Built using Plotly Express for high-quality visualizations
- Structured for deployment in Dash or lightweight web apps in the future
- Uses Pandas for transformation and aggregation of time-series insurance data
- Optimized for readability and quick business takeaways
To-Do / Roadmap
The dashboard is designed to evolve iteratively. Here's what’s next:
| Task | Priority | Description |
|---|---|---|
| Implement dynamic filters by agent and product | High | Enable real-time drill-down for deeper analysis |
| Add additional metrics (Revenue, Claims, Growth Rate) | High | Expand the dashboard's analytical scope |
| Build and integrate the Executive Summary Generator | High | Automate the creation of plain-language business insights |
| Introduce region-wise sales heatmap | Medium | Add geographic analysis capability |
| Connect to real-time or automated data sources (e.g., SQLite, API) | Medium | Make the dashboard fully dynamic and scalable |
| Clean up inconsistencies in agent name data | Low | Improve reliability and data quality over time |
| Deploy dashboard using Dash or Flask | Low | Make the tool accessible via web and mobile devices |